10-14, 4.80 ERA, 3.91 FIP, 2.6 WAR, 202 IP
12-8, 3.38 ERA, 3.69 FIP, 3.1 WAR, 173 IP
8-9, 4.57 ERA, 4.68 FIP, 1.3 WAR, 170 IP
Three different pitchers? No, it's Ryan Dempster in three different years. Although it might seem like an unlucky but still somewhat decent innings-eater, a nice two- or three-starter, and a pitcher who flat-out sucks, this is Ryan Dempster in 2011, 2012, and 2013.
So: What has befallen Ryan Dempster? It appears obvious:
2011 HR/9 rate: 1.02
2012 HR/9 rate: 0.99
2013 HR/9 rate: 1.37
2011 BABIP: .324
2012 BABIP: .277
2013 BABIP: .296
2011 K/BB: 2.33
2012 K/BB: 2.94
2013 K/BB: 1.99
So, a recap: In 2011-12, Ryan Dempster was giving up about one homer per every nine innings. This puts him pretty below-average homer-wise, around Mike Leake, Mike MInor, and Edinson Volquez.
In 2013, that rate surged to 1.37. This was sixth-worst in the league among qualifying pitchers. He was around RA Dickey and Ian Kennedy.
His low 2012 BABIP also proved something: Those with career .300 BABIPs should not be expected to post .277 BABIPs.
And, of course, he wasn't throwing as many strikes, which tends to be a problem.
An examination of some fangraphs batted-ball stats reveals that his fly-ball rate ticked up two percent. His ground-ball rate went down accordingly.
His fastball rate reveals this:
2011: 57%
2012: 45%
2013: 49%
His slider rate has steadily gone down. And after debuting an 11% cutter rate last season, he's docked that to 5%. What's gone up? His splitter.
If the stats can be trusted, he's obviously starting to hang splitters. Or the Red Sox probably shouldn't have signed a 35-year-old to a 13-million-a-year deal.
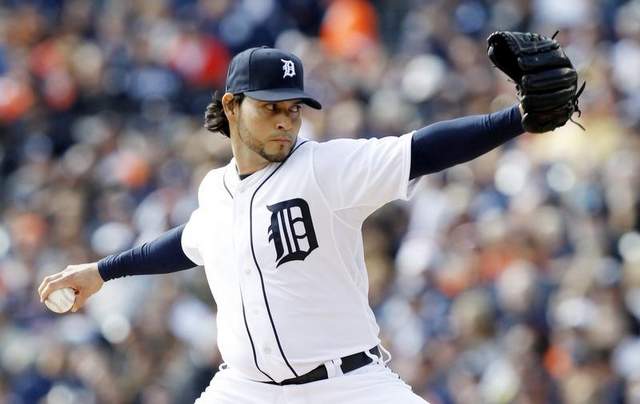
I tuned into game one of the Tigers-Red Sox series out of curiosity in the fifth inning. I'm not positive, but I think the announcers mentioned "no-hitter" about 4,658 times.
Anibal Sanchez was dominant. The only thing Red Sox hitters could do against Sanchez was draw six walks in six innings. Sanchez struck out twelve but was forced to leave after 116 pitches (after 116, there's a decent chance he would've lost the no-hitter anyway) so three relievers could continue the combined no hitter: Al Alburquerque, Jose Veras, and Drew Smyly.
Enter Joaquin Benoit. Nobody cared about the 1-0 lead that much anymore. The announcers used the opportunity to show video of despairing Sox fans and use the term "no-hitter" about 6,572 more times.
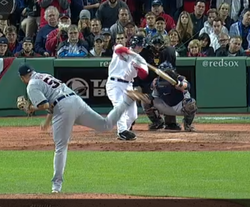
The pitch that ended the no-hitter was a 1-2 to Daniel Nava. A high fastball at 95 mph that Nava easily slapped into center.
I remember watching, thinking: Is this really going to happen? A no-hitter? I'd missed Roy Halladay years earlier. Then, I'd scold myself for thinking about it, then I'd realize it didn't matter with these announcers anyway.
I didn't get a no hitter. But I'm still glad I finished watching.
Let's set the scene for another pro/con sabermetrics debate. You're the manager for a team, and let's say your team is up by one in the eighth. No outs, setup man pitching. A double is allowed. Things are getting tricky. A man with a career 1.39 ERA just happens to be ready to pitch. What do you do? If you're Fredi Gonzalez, nothing.
A defense of Fredi Gonzalez: most of MLB's managers, respected or otherwise (and Gonzalez has certainly earned some respect in his Braves managing tenure) would have done the same thing: keep in the man with the respectable career 3.65 ERA (David Carpenter) rather than the man with the dominant career 1.39 ERA (Craig Kimbrel).
However, by about any metric, Kimbrel is the best Braves reliever, and this would probably be the most important six outs of the game.
So why Carpenter, not Kimbrel?
The point of the closer is that the closer is the best reliever, so put them in the "important" ninth inning.
In this scenario, which happens to currently be the only scenario (even the sabermetric A's have Grant Balfour in almost every save situation. Then again, they probably know plenty of Grant Balfour Tidbits that I don't), a manager will gladly sit his closer with the bases loaded, no outs, Miguel Cabrera up, and the score 4-3...so the closer, barring the setup man induces a triple play, can come in with the bases empty.
Something about this makes no sense at all.
 Daniel Murphy after a walk off hit last season. This has nothing to do with the topic.
How to translate team luck ratio into an impact on wins? We can't just subtract team luck ratio from wins. And so a roadbump is hit.
Or... 10(TLR-1). So a TLR of 1.2 yields in 2 wins lost the next year. A TLR of 0.8? 2 wins gained. However, this obviously isn't the case, because 0.8 is 20% below 1, and two wins isn't 20% below 65. Neither is 63, in case you're wondering.
So, stay tuned while the search continues!
Baseball has a lot of luck involved. Take all those softly-hit bloopers that would have been pop outs anywhere but where they actually landed (in between the second baseman and right fielder), or all those one-out, runner-on-first hard ground balls that look like double plays until they scoot up the middle. And it isn't like the hitter is aiming for the diamond-cutter. Now compare those to the one-out, runners on second and third, down by one line drives with the runners going. Anywhere else and you take the lead, but no, it's at the third baseman, who steps on third for a double play. It's not too even.
But now, we're coming up with a very basic luck ratio. You only need two numbers and a calculator, and the two numbers can be found on fangraphs.
OPTION A: ARITHMETIC LUCK RATIO
The formula to calculate how lucky your team is BABIP-wise!
(Hitters BABIP)/League BABIP + League BABIP/(Pitchers BABIP). Take this number and divide by two to get Arithmetic Team Luck Ratio. One is average.
OPTION B (The better one): GEOMETRIC LUCK RATIO
I originally wanted to tinker with a geometric mean, being (Hitters BABIP)/League BABIP x League BABIP/Pitchers BABIP, Geometric Team Luck Ratio being the square root of that. But this can be simplified to Hitters BABIP x 1/Pitchers BABIP, which can then go to this.
The square root of (Hitters BABIP/Pitchers BABIP).
Easy to find. A new stat is born. Research coming up soon!
This will be a short post.
Attempts to Forecast Team Win-Loss Records
A.) Obviously, you factor in the WINNING PERCENTAGE from the last year. The 0.605 winning percentage 2012 Nationals figure to have a better chance at a 0.600 percentage, than, say, my favorite team (The .377 Cubs.)
B.) PLAYER ADDITIONS can be factored in using WAR. For Example: If the Cubs sign a 6 WAR player to replace their 2.5 WAR in a position, you add 3.5 wins to their expected total. Sounds easy.
C.) LUCK Batting Average on Balls in Play is a good measure of luck. We'll assume the players on a team round out to even. An example of a New Murphy Times stat called "Team Luck Score":
[(Batter's BABIP/League BABIP) + (League BABIP/Pitcher's BABIP)]/2.
Average is one, of course.
Tune in for another installment and Team Luck Score rankings!
Adrian Beltre and Miguel Cabrera headline the top third base options. https://docs.google.com/spreadsheet/ccc?key=0ArWXqkabsFMwdHdPbS1fSjBMQy1Od3I2YzE5S3dGTGc#gid=0
(Warning, the individual categories are ranked, but the overall is out of ninety)
We ranked some of the top third baseman by WAR, and then sorted them out. We're not trying to outsmart anybody in this post: just outlining what they've done in the five fantasy categories.
Tier One: Miguel Cabrera (78 Points)
Cabrera doesn't do much in steals, but he's a four-category monster, with a .360 average and 40 HRs.
Tier Two:
Adrian Beltre (64 Points)
Manny Machado (63 Points)
Kyle Seager (61 Points)
Beltre is second for homers, average, runs, and RBIs for those unluckily not named Miguel Cabrera. Seager is solid around the board, and Machado gets high marks in runs and steals.
Tier Three:
Josh Donaldson (57 Points)
Evan Longoria (56 Points)
Both Donaldson and Longoria are good sources of homers, RBIs, and average. Donaldson's Batting Average on Balls in Play is unusually high, so treat with caution.
Tier Four:
Pedro Alvarez (47 Points)
Ryan Zimmerman (44 Points)
Martin Prado (43 Points)
Need HR's and RBI's? Get Alvarez. He's a lot cheaper than the two guys around him, Cabrera and Beltre. Zimmerman and Prado are not the best options for anything, but decent for all.
Tier Five:
David Wright (59 Points)
Todd Frazier (35 Points)
Chris Johnson (31 Points)
Wright's hurt, so hold him if you can (but don't try to buy low on a guy with no timetable). Frazier's not a great option, but if your starting 3B's on Tier Six, he's really cheap! Johnson should be a lot higher and is great at average. The other categories are hurt because he was a part-time guy at the start of the year.
Tier Six:
Chase Headley (27 Points)
Nolan Arenado (25 Points)
Pablo Sandoval (24 Points)
Brett Lawrie (23 Points)
Donnie Murphy (14 Points)
Mike Moustsuakas (15 Points)
Headley is massively disappointing, Arenado isn't doing anything on the road and isn't worth too much at home, Sandoval isn't doing so great with a .266 average on the slumping Giants, Lawrie is disappointing, Murphy should cool down eventually, and just stay away from Moustsuakas, who is 8 points from the nearest full-time player.
Note the absences of David Freese (part-time player now) and Luis Valbuena (injury).
|

 RSS Feed